

1-Minute Lesson 13 Understanding the Histogram – Stop Guessing Exposure
May 02, 2026
Lesson 13 in Photography 101
Understanding the Histogram – Stop Guessing Exposure


If you’re judging exposure only by looking at the back screen…
You’re guessing.
The histogram tells you the truth.
📊 What Is a Histogram?
It’s a graph that shows the brightness levels in your image.
Left side → Shadows (dark tones)
Middle → Midtones
Right side → Highlights (bright tones)
It does NOT show sharpness.
It does NOT show composition.
It shows exposure distribution.
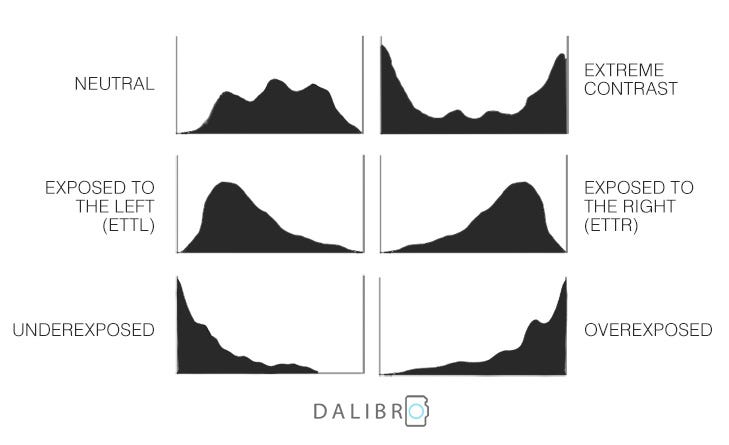
⬅️ When the Graph Is Pushed Left
You’re likely underexposed.
- Loss of shadow detail
- Dark image
- More noise when brightened later
Sometimes this is intentional (moody scenes).
Just make sure it’s on purpose.
➡️ When the Graph Is Pushed Right
You may be overexposed.
- Blown highlights
- Lost detail in sky or snow
- White areas with no recovery
Once highlights are clipped, they’re usually gone.
⚖️ The “Balanced” Histogram
Many well-exposed images show:
- A gentle curve
- Information across the range
- No hard clipping on either side
But remember:
Not every good image has a perfect bell curve.
A snowy scene will lean right.
A night scene will lean left.
Context matters.
🎯 Why This Matters
Your camera screen can:
- Look bright in sunlight
- Look dark at night
- Trick your eyes
The histogram doesn’t lie.
🧠 Pro Tip
Turn on:
- Histogram display
- Highlight warnings (“blinkies”)
Especially helpful for:
- Snow
- Wildlife in bright sun
- High contrast scenes
📌 Challenge
Photograph a high-contrast scene (bright sky + dark subject).
Adjust exposure until:
- You protect the highlights
- Shadows still hold detail
Post your histogram screenshot with your photo 👇
https://www.facebook.com/groups/1236820218316346

